
Last night we got a (delicious) smackdown of a SuperBowl. Heathen Central didn’t have a normal dog in the fight, but ended up rooting for Seattle for two reasons:
- The weird shameful racist reaction to Richard Sherman; and
- The fact that Seattle has more Alabama players than Denver.
Add in a little bit of underdog-ism — Seattle’s never won the Super Bowl, but playing in one and winning is old hat to Peyton and the Broncos — and it’s good enough for us. (And enough to overcome a distaste for Pete Carroll.)
Turns out, a more smashmouth, old-school style of football — dare we call it “SEC”? — still works in the NFL, and that was nice to see. As they say, defense wins championships.
However, it made me wonder about the SuperBowl and margins of victory. I thought I remembered a time when the big game was almost always a blowout, but over time there’s no real clear trend. Most of the Super Bowls have been fairly close — 56% of them were won by two touchdowns or less. Increase the margin to three touchdowns, and you’re over 77%.
Actual blowouts — which we’ll define as four touchdowns or more — have actually been pretty rare: only 6, or about 13%. Yesterday’s was the first such victory in 20 years. They were (SB record in bold):
- 29 points in Super Bowl XVIII, in 1984 (LA Raiders 38, Redskins 9)
- 36 points in Super Bowl XX, in 1986 (Bears 46, Pats 10)
- 32 points in Super Bowl XXII, in 1988 (Redskins 42, Broncos 3)
- 45 points in Super Bowl XXIV, in 1990 (49ers 55, Broncos 10)
- 35 points in Super Bowl XXVII, in 1993 (Cowboys 52, Bills 17)
- 35 points in Super Bowl XLVIII, yesterday (Seahawks 43, Broncos 8)
It’s clear where my sense of “blowouts are the norm” comes from, considering that 5 of the 6 blowouts happened when I was in high school and college and was paying attention as a quasi-adult for the first time. Overall, the game is usually close(ish), as the data shows.
Anyway, because I’m a dork, here’s a graph:
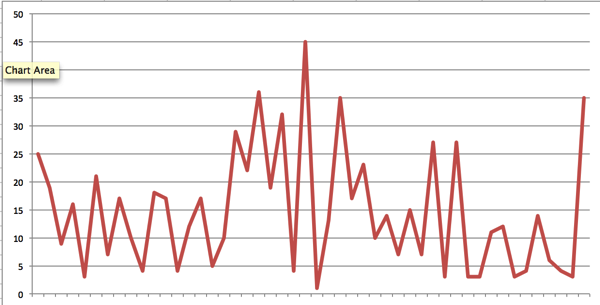
Note: There are two 27-point victories since 1993: XXXV (Ravens 34, Giants 7) and XXXVII (Bucs 48, Raiders 21), which almost count — but even the most recent of those is 11 years ago. Since 2003, the margin of victory has only been as high as 14 once, and is only over 10 three times.