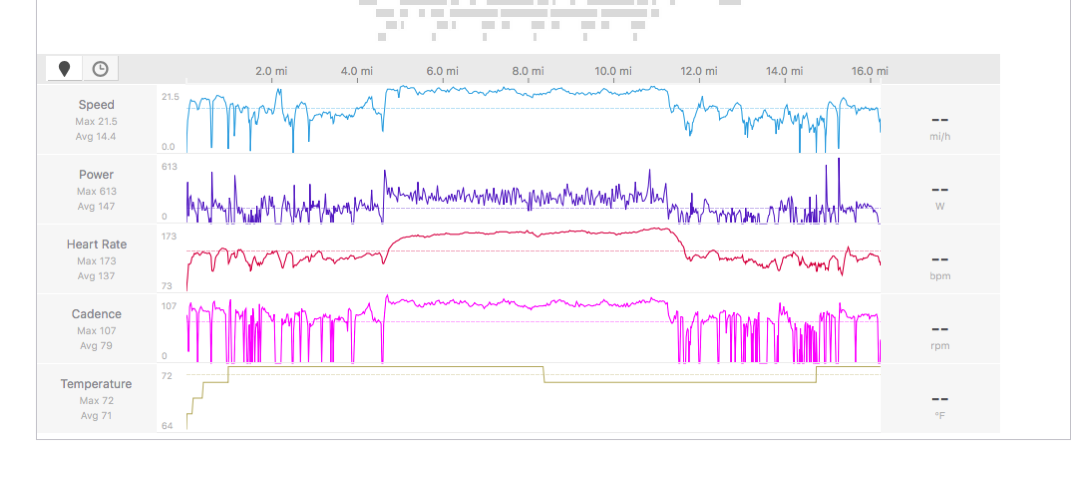
I like riding, and I like data. I also like getting faster, so with the encouragement of a friend who offered to coach, I bought a power meter for my bike to facilitate more directed training.
In order for this to be useful, though, I also needed to establish a baseline of my maximum sustained effort. Cyclists call this the Functional Threshold Power. The truer test is an hour long ride where you go as hard as you can for the whole hour, leaving nothing in the tank.
That’s obviously unpleasant (you’re alone) and hard to gauge (am I going to fast? too slow?), so the more common approach is to do a 20 minute test and multiply by .95, which is what I did today.
This isn’t the sort of thing you want to do on public roads, obviously; fortunately, Houston has Memorial Park and the Picnic Loop, which is a closed, paved track available for public use. When the weather’s nice, you see lots of riders on it, but also walkers and whatnot. Anyway, it’s close enough to the house that I used the ride over as a little warmup, and then started the FTP test as soon as I hit the entrance to the track.
After 20 minutes, I backed off, exited the track, and rode home.
So, can you see the part of this graph from Strava that represents the 20 minute test?

